Analytics & Statistics
The Baza Booking Calendar statistics dashboard delivers an enterprise-grade analytics suite specifically engineered for WordPress site administrators, hospitality managers, and independent service providers who require deep visibility into their reservation pipelines. By transforming raw booking data into actionable business intelligence, this interface empowers operators to optimize scheduling workflows, maximize hotel and appointment reservation revenue, and monitor customer engagement metrics directly from the WordPress admin panel without relying on external third-party software.
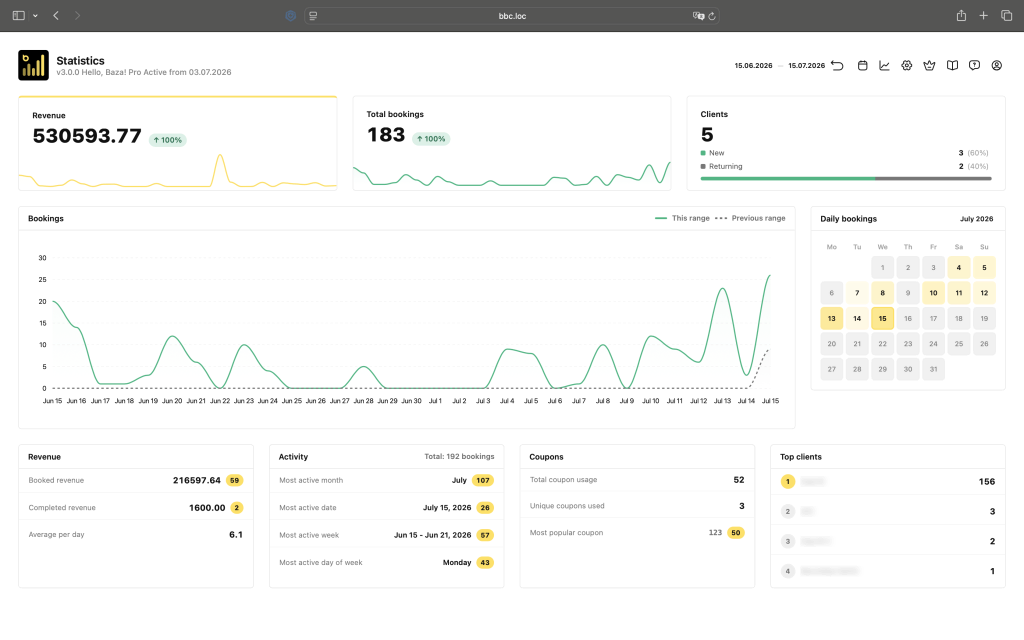
Date Range Filtering & Real-Time Controls
At the core of the dashboard’s superior usability is the advanced date range filtering system located in the upper right corner. This control mechanism enables administrators to query custom timeframes instantly, comparing historical operational windows against real-time data to evaluate seasonal shifts, analyze performance trajectories, and generate precise financial audit reports.
Core Performance KPI Cards
Directly adjacent to these filters, the high-level Key Performance Indicator cards provide immediate visibility into business health. They track cumulative gross earnings alongside percentage growth indicators, overall booking volumes, and unique client tallies segmented meticulously into first-time bookers and returning customers to measure long-term customer retention.
Interactive Bookings Trend Chart
The central interactive trend chart serves as a dynamic visualization tool for reservation frequency, utilizing comparative multi-line tracking between the current operational range and previous periods. This capability allows managers to effortlessly identify demand spikes, measure marketing campaign efficacy, and forecast high-traffic operational cycles.
Daily Bookings Calendar Matrix
Complementing this timeline is the daily bookings calendar matrix, an intuitive monthly view that highlights active reservation density per day. This layout assists management with staffing optimization, resource allocation, and the prevention of scheduling bottlenecks during peak operational periods.
Detailed Analytics & Advanced Metrics Breakdown
Further expanding the analytical depth, the lower section of the dashboard categorizes granular operational data into distinct pillars covering revenue metrics, activity tracking, promotional performance, and client rankings. The revenue analytics monitor secured capital from incoming reservations alongside realized income from fully serviced stays, while calculating daily earning velocities to maintain consistent cash flow. Concurrently, the activity module pinpoints historical high-demand milestones and identifies consumer scheduling habits down to specific days of the week, enabling businesses to fine-tune marketing schedules and promotional campaigns. Furthermore, the coupon performance tracking evaluates promotional adoption rates and identifies top-performing discount codes, while the top clients leaderboard ranks highest-value patrons by booking frequency to facilitate targeted VIP retention strategies and loyalty programs.